Everyone knows the iconic Finviz heatmap as it’s a go-to tool for quickly visualizing how the overall market is performing.
But here’s something most traders miss:
👉 You can create a custom heatmap that only shows your personal holdings.
It’s the perfect way to track your basket of stocks visually and instantly see what’s up, what’s down, and what’s moving.
Here’s how to set it up:
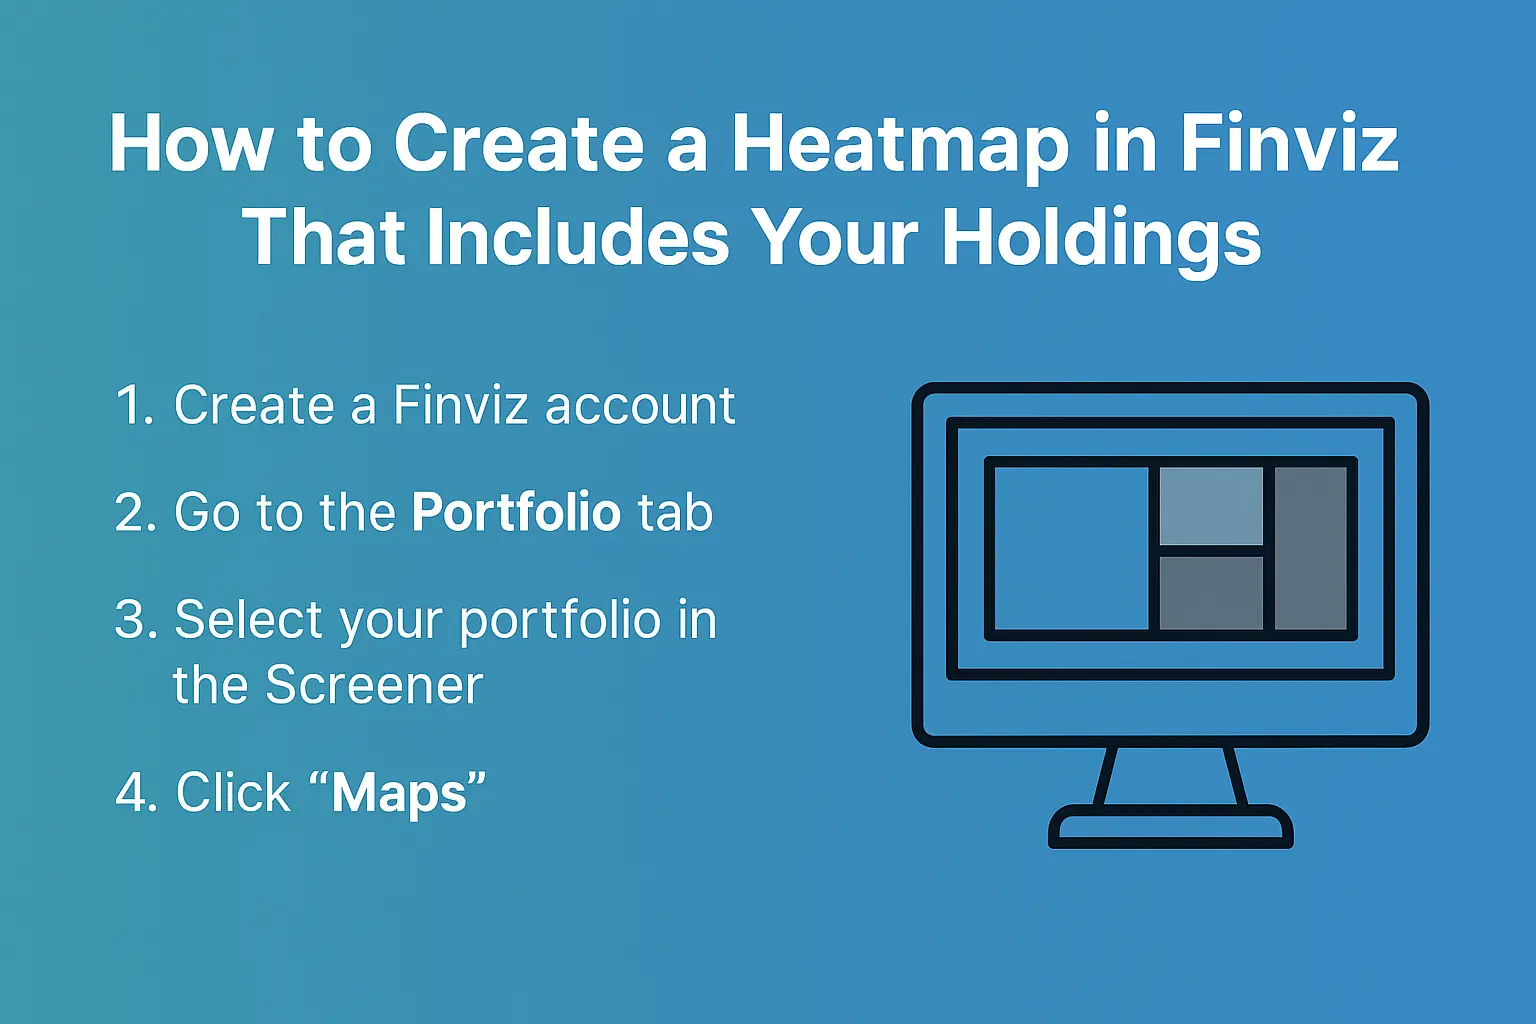
Step-by-Step: Create a Custom Holdings Heatmap on Finviz
1. Create a Finviz Account
Head to Finviz.com and sign up for a free or paid account.
- Free accounts get 15-minute delayed quotes
- Finviz Elite gives you real-time data, which is a game-changer for active traders
2. Go to the Portfolio Tab
Click over to the “Portfolio” section and create a new portfolio with your holdings and make sure to save it.
3. Head to the Screener
Once your portfolio is saved, go to the “Screener” tab at the top of the page and then select “My Presets” and choose the portfolio you have just created.

4. Click “Maps”
Now click on the “Maps” tab in the top navigation bar.
Finviz will generate a heatmap of just your holdings, updating in real-time if you’re using Elite.

Final Thoughts
Custom heatmaps are a simple but powerful way to stay on top of your positions. Whether you’re holding 5 stocks or 50, this view gives you instant insight into performance, sector allocation, and momentum — all at a glance.
Want real-time tracking of your holdings?
👉 Get our exclusive Finviz Elite discount here